TSMaster is a domestic automotive bus tool chain software platform developed by TOSUN, which is a professional tool for all-round automotive bus design, simulation, analysis, diagnosis and calibration, and supports the whole system development process from demand analysis to system realization.TSMaster software can connect, configure and control all TOSUN hardware interface cards to realize the automotive bus monitoring, simulation, diagnosis, calibration, BootLoader, I/O control, measurement and testing, EOL and other occasions of functional requirements. And support Vector, Kvaser, PCAN, Intepace, Zhou Ligong bus series products hardware and mainstream instruments on the market, can realize multi-hardware, multi-channel joint simulation, testing. In the early days, I have organized a Q&A guide for the user's use of theevident in the articleTheSharing | Q&A Guide for Frequently Asked Questions about TOSUN Hardware Interface Cards and TSMaster SoftwareTheAs there are more and more TSMaster software users, it is inevitable that you will encounter some new problems in the process of using it, and the following will be a detailed answer to several frequently encountered problems.
Table of Contents for this article
01. TSMaster Analysis Module
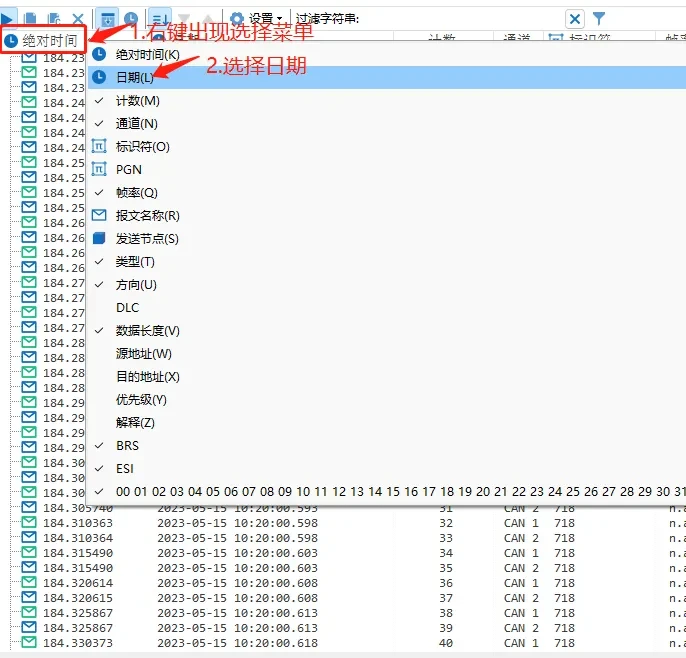
1、Q:Can the time display of the message in the trace window be shown as Beijing time?
A: Right click on the absolute time and select the "Date" option.
2、Q: the same star of the four can channel respectively loaded DBC, but can save only the first can channel under the DBC, the other three channels again when you open the software is gone, need to re-add, is why?
A: If you are using several databases with the same network name, it will load only one DBC file by default, you can modify the network name to make it successful.
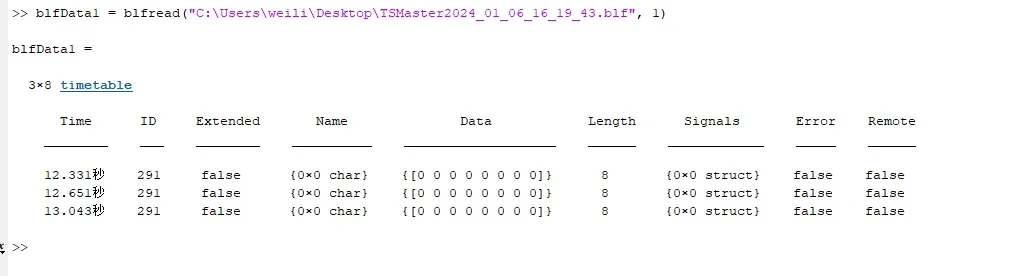
3、Q:Why is it that when I use TSMaster to record CAN FD data and parse it with MATLAB, I can't parse it out, but when I use canoe to convert it again, blf to blf, MATLAB can parse it out?
A: The CAN FD blf file recorded in TSMaster version 2024.1.7 is different from canoe, and can be parsed normally by MATLAB after updating the version.
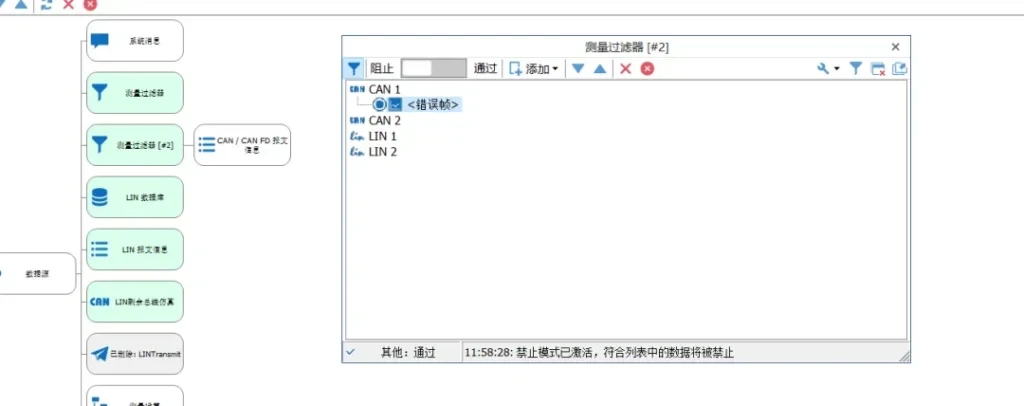
4. Q: How to filter error frames in CAN messages?
A: You can find the message information window in the measurement settings of the analysis, insert a filter in front of the message information window, and add the error frame filter to the channel you want to filter.
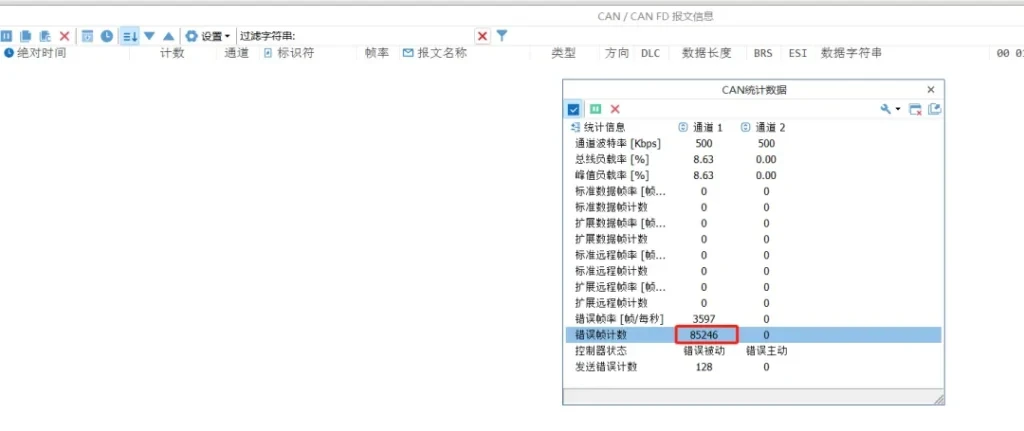
You can see that there are no error frames in the message window, but the count of error frames is still accumulating in the statistics.
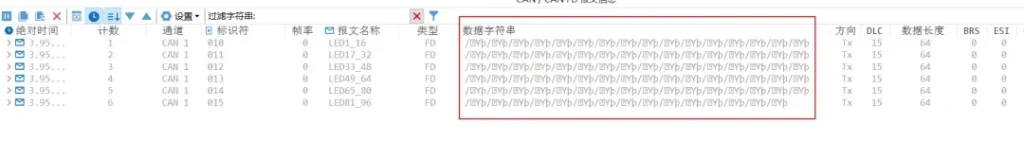
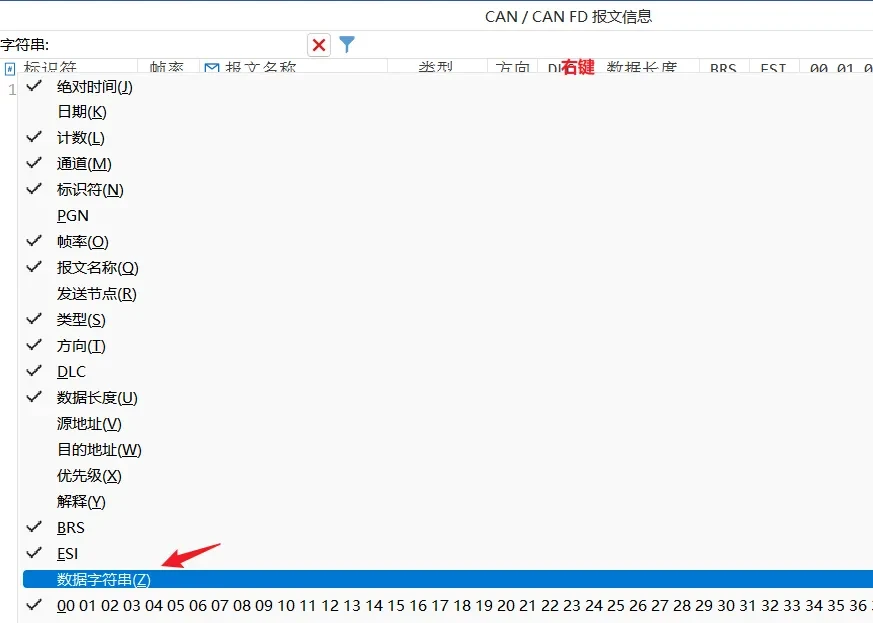
5. Q: Why is the data string in the message information window garbled?

02. TSMaster Graphic Window
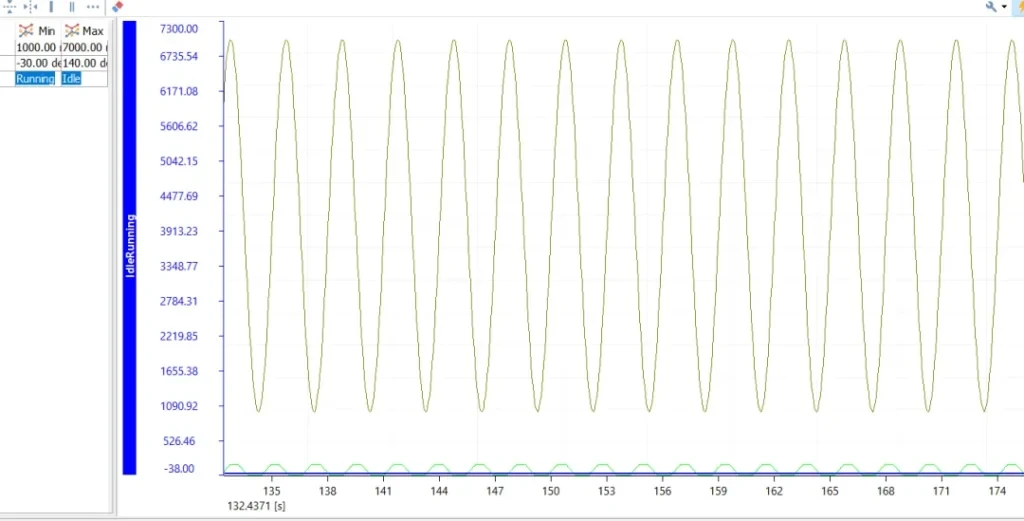
1、Q: The graphical interface observes two signals in the same axis, but the Y-axis values of these two signals are not the same, can they be adjusted to be the same? For example, can you put multiple signals on the same y-axis to compare their values?
A: Just set the maximum and minimum values of multiple signals to be the same.
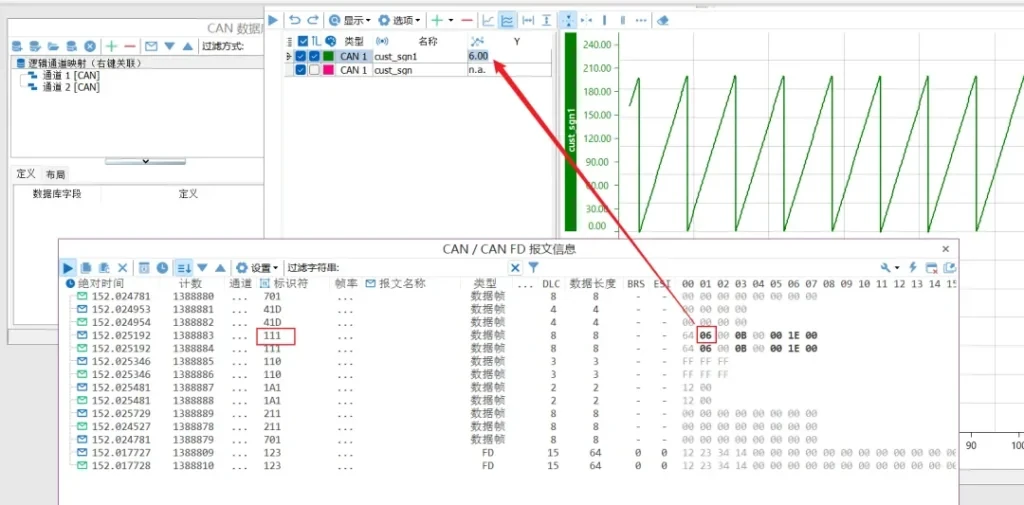
2、Q: What is the reason for the failure of adding messages to the graph?
A: Graphics cannot display messages, only signals:
- Adding custom signals to a graph pattern
- Input message ID
- Define the starting bit and length of the signal, the amplification factor and so on.

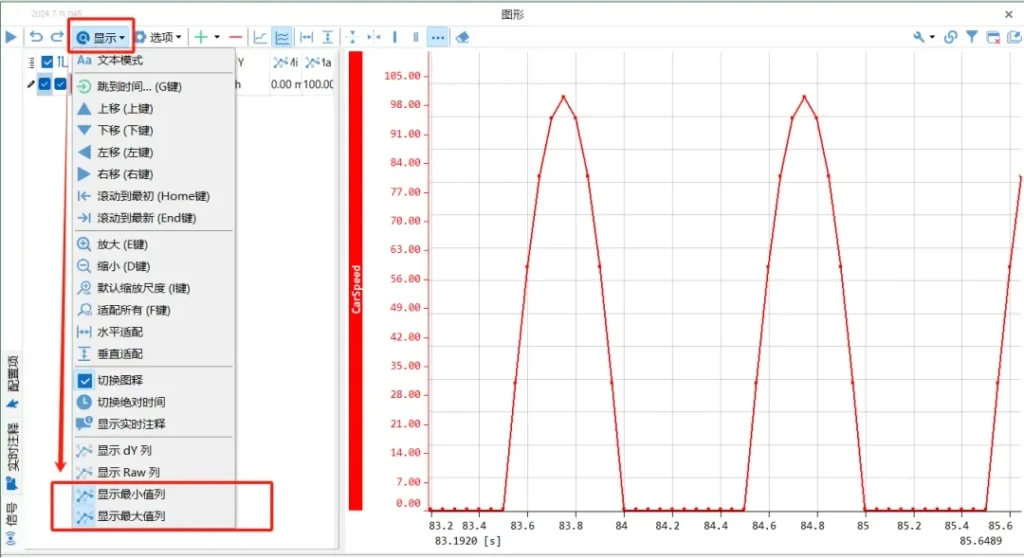
3、Q:Can the graphical interface of TSMaster support the display of the maximum and minimum values of signals in the graph?
A: Yes, you can, in the graphical interface of the display function in the display of the maximum value column and display the minimum value column, as shown in the figure.
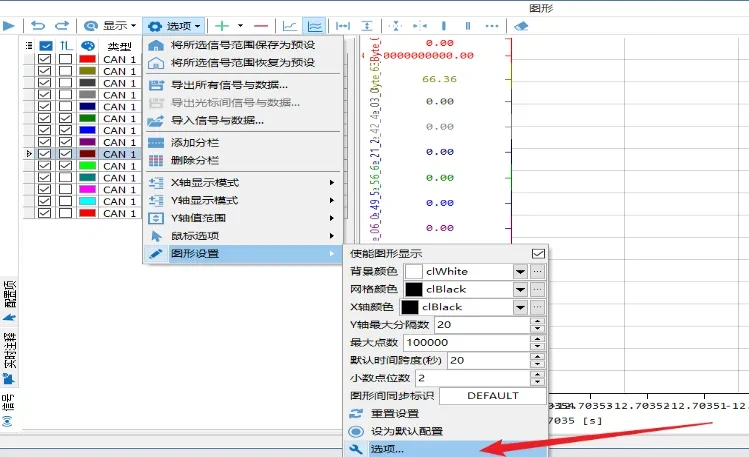
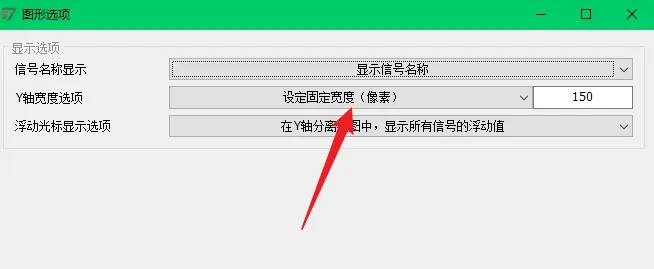
4、Q:How to adjust the width of the Y-axis of the graph?
A: The setting path is: Graphics Window->Options->Graphics Settings->Options->Y-axis width option (as below); here you can customize the Y-axis width.
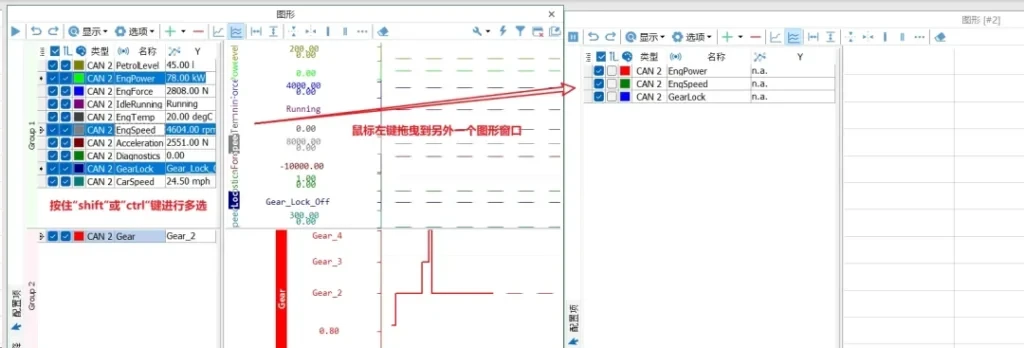
5、Q:How to realize selecting single or multiple signals in the graph and copying them to another graph window?
A: You can select multiple signals by "shift" or "ctrl" and keep holding down the "shift" or "ctrl" key to drag them to another graphic window with the left mouse button. ctrl" key and drag them to another graphic window with the left mouse button.
summarize
The above is this issue on the use of TSMaster software encountered a few common problems to give you detailed answers and organization. If you have any doubts in the use of TSMaster software, you can pay attention to the TOSUN public number and leave a message or private message below, we will be happy to help you solve the problem.
Note: TOSUN Technical Support Email:support@tosunai.cnWe welcome inquiries! (Company and contact information must be indicated)